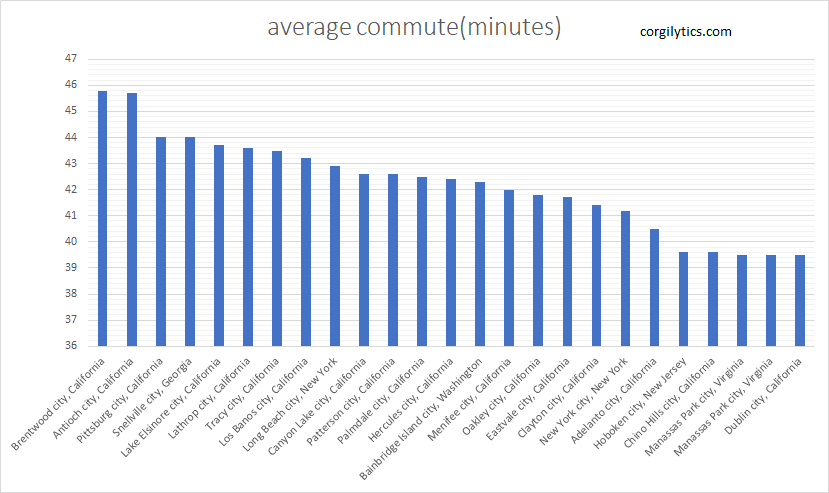
Longest Commute by City, over 10,000 population
As shown below, California is home to 8 of the top 10 longest commutes (for cities >10k residents), and 18 of the top 25– with many cities being located in the Southern California-Los Angeles corridor. While California leads the nation in cities with high average commutes– the state average (shown further down this page), is actually 5th among states (6th if you count DC), so the entire state doesn’t have above average commutes. Somewhat related to commuting– California has the 2nd most miles of highway, at over
7,600
miles (beaten by Texas, with over 13,000 miles). To consider: Brentwood, CA’s average commute of around 46 minutes is over 4.6x higher than the shortest city– Pierre, SD, with an average commute of around 10 minutes.
| geography | average commute(minutes) | geography population |
|---|---|---|
| Brentwood, California | 45.8 | 60,446 |
| Antioch, California | 45.7 | 110,730 |
| Pittsburg, California | 44 | 70,492 |
| Snellville, Georgia | 44 | 19,631 |
| Lake Elsinore, California | 43.7 | 64,037 |
| Lathrop, California | 43.6 | 21,393 |
| Tracy, California | 43.5 | 88,806 |
| Los Banos, California | 43.2 | 38,119 |
| Long Beach, New York | 42.9 | 33,509 |
| Canyon Lake, California | 42.6 | 11,106 |
| Patterson, California | 42.6 | 21,783 |
| Palmdale, California | 42.5 | 156,904 |
| Hercules, California | 42.4 | 25,343 |
| Bainbridge Island, Washington | 42.3 | 24,060 |
| Menifee, California | 42 | 88,515 |
| Oakley, California | 41.8 | 40,669 |
| Eastvale, California | 41.7 | 61,337 |
| Clayton, California | 41.4 | 11,967 |
| New York, New York | 41.2 | 8,443,713 |
| Adelanto, California | 40.5 | 33,416 |
| Hoboken, New Jersey | 39.6 | 53,211 |
| Chino Hills, California | 39.6 | 79,298 |
| Manassas Park, Virginia | 39.5 | 16,423 |
| Dublin, California | 39.5 | 59,172 |
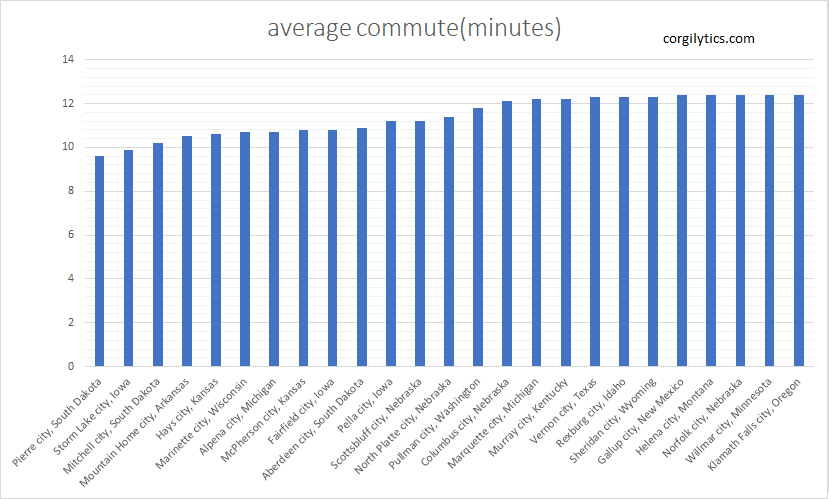
Shortest Commute by City, over 10,000 population
No surprises for shortest commutes– small, sparsely populated cities across the mid-west and south-west dominate the shortest commutes list. Even the longest commute on this list, Klamath Falls, OR is less than a third of many of the longest commutes listed earlier.
| geography | average commute(minutes) | geography population |
|---|---|---|
| Pierre, South Dakota | 9.6 | 13,988 |
| Storm Lake, Iowa | 9.9 | 10,672 |
| Mitchell, South Dakota | 10.2 | 15,722 |
| Mountain Home, Arkansas | 10.5 | 12,303 |
| Hays, Kansas | 10.6 | 20,956 |
| Marinette, Wisconsin | 10.7 | 10,678 |
| Alpena, Michigan | 10.7 | 10,086 |
| McPherson, Kansas | 10.8 | 13,041 |
| Fairfield, Iowa | 10.8 | 10,216 |
| Aberdeen, South Dakota | 10.9 | 28,124 |
| Pella, Iowa | 11.2 | 10,273 |
| Scottsbluff, Nebraska | 11.2 | 14,805 |
| North Platte, Nebraska | 11.4 | 24,011 |
| Pullman, Washington | 11.8 | 33,050 |
| Columbus, Nebraska | 12.1 | 22,992 |
| Marquette, Michigan | 12.2 | 20,932 |
| Murray, Kentucky | 12.2 | 19,037 |
| Vernon, Texas | 12.3 | 10,685 |
| Rexburg, Idaho | 12.3 | 27,957 |
| Sheridan, Wyoming | 12.3 | 17,825 |
| Gallup, New Mexico | 12.4 | 22,105 |
| Helena, Montana | 12.4 | 31,212 |
| Norfolk, Nebraska | 12.4 | 24,446 |
| Willmar, Minnesota | 12.4 | 19,618 |
| Klamath Falls, Oregon | 12.4 | 21,138 |
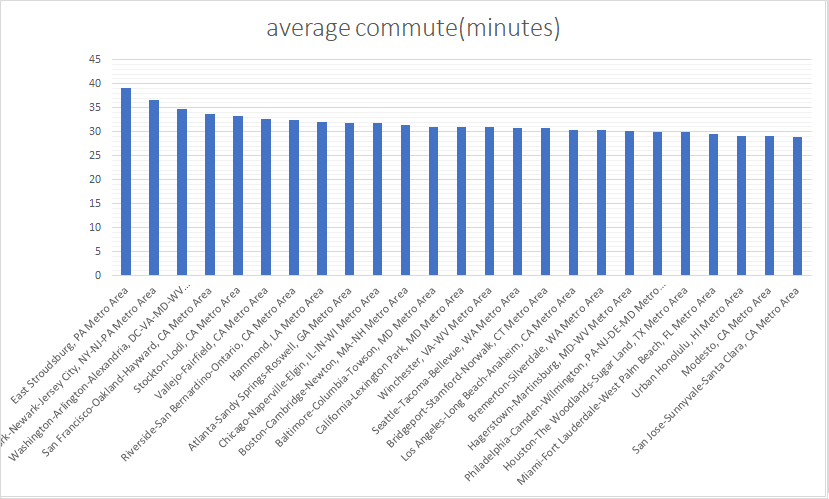
Longest Commute by Metro, over 50,000 population
Leading the way for longest metro area commutes is the lesser known East Stroudsburg area– an area that is roughly equidistant between Scranton, New York/Newark and Allentown. California is notably less dominant– with only 5 metros cracking the top 10, with the east coast actually claiming the top 3 spots and the two less densely populated (more remote) Stockton and Vallejo metros ranking 4th and 5th.
| geography | average commute(minutes) | geography population |
|---|---|---|
| East Stroudsburg, PA Metro Area | 39.1 | 167,586 |
| New York-Newark-Jersey, NY-NJ-PA Metro Area | 36.7 | 19,990,592 |
| Washington-Arlington-Alexandria, DC-VA-MD-WV Metro Area | 34.8 | 6,138,382 |
| San Francisco-Oakland-Hayward, CA Metro Area | 33.6 | 4,673,221 |
| Stockton-Lodi, CA Metro Area | 33.2 | 732,212 |
| Vallejo-Fairfield, CA Metro Area | 32.6 | 438,530 |
| Riverside-San Bernardino-Ontario, CA Metro Area | 32.4 | 4,518,699 |
| Hammond, LA Metro Area | 32 | 130,504 |
| Atlanta-Sandy Springs-Roswell, GA Metro Area | 31.9 | 5,779,463 |
| Chicago-Naperville-Elgin, IL-IN-WI Metro Area | 31.9 | 9,536,428 |
| Boston-Cambridge-Newton, MA-NH Metro Area | 31.4 | 4,811,732 |
| Baltimore-Columbia-Towson, MD Metro Area | 31 | 2,793,250 |
| California-Lexington Park, MD Metro Area | 30.9 | 111,531 |
| Winchester, VA-WV Metro Area | 30.9 | 136,305 |
| Seattle-Tacoma-Bellevue, WA Metro Area | 30.7 | 3,809,717 |
| Bridgeport-Stamford-Norwalk, CT Metro Area | 30.7 | 944,348 |
| Los Angeles-Long Beach-Anaheim, CA Metro Area | 30.4 | 13,262,234 |
| Bremerton-Silverdale, WA Metro Area | 30.4 | 262,475 |
| Hagerstown-Martinsburg, MD-WV Metro Area | 30.1 | 263,306 |
| Philadelphia-Camden-Wilmington, PA-NJ-DE-MD Metro Area | 29.9 | 6,069,448 |
| Houston-The Woodlands-Sugar Land, TX Metro Area | 29.9 | 6,779,104 |
| Miami-Fort Lauderdale-West Palm Beach, FL Metro Area | 29.5 | 6,070,944 |
| Urban Honolulu, HI Metro Area | 29.1 | 987,638 |
| Modesto, CA Metro Area | 29 | 539,301 |
| San Jose-Sunnyvale-Santa Clara, CA Metro Area | 28.9 | 1,981,616 |
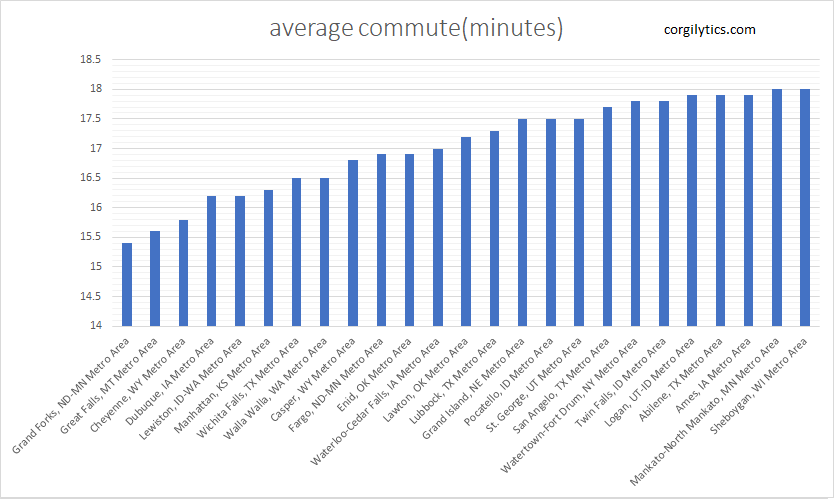
Shortest Commute by Metro, over 50,000 population
The shortest metro area commutes mirrors the shortest city listing– likely due to metros being more dominated by single cities. Only 2 of these metros have more than 200,000 inhabitants, while most are below 100,000 people.
| geography | average commute(minutes) | geography population |
|---|---|---|
| Grand Forks, ND-MN Metro Area | 15.4 | 101,991 |
| Great Falls, MT Metro Area | 15.6 | 81,746 |
| Cheyenne, WY Metro Area | 15.8 | 97,692 |
| Dubuque, IA Metro Area | 16.2 | 96,802 |
| Lewiston, ID-WA Metro Area | 16.2 | 62,492 |
| Manhattan, KS Metro Area | 16.3 | 98,841 |
| Wichita Falls, TX Metro Area | 16.5 | 150,994 |
| Walla Walla, WA Metro Area | 16.5 | 64,237 |
| Casper, WY Metro Area | 16.8 | 80,610 |
| Fargo, ND-MN Metro Area | 16.9 | 237,003 |
| Enid, OK Metro Area | 16.9 | 62,190 |
| Waterloo-Cedar Falls, IA Metro Area | 17 | 170,132 |
| Lawton, OK Metro Area | 17.2 | 128,490 |
| Lubbock, TX Metro Area | 17.3 | 313,123 |
| Grand Island, NE Metro Area | 17.5 | 84,729 |
| Pocatello, ID Metro Area | 17.5 | 85,065 |
| St. George, UT Metro Area | 17.5 | 160,537 |
| San Angelo, TX Metro Area | 17.7 | 118,990 |
| Watertown-Fort Drum, NY Metro Area | 17.8 | 114,448 |
| Twin Falls, ID Metro Area | 17.8 | 107,097 |
| Logan, UT-ID Metro Area | 17.9 | 135,615 |
| Abilene, TX Metro Area | 17.9 | 170,009 |
| Ames, IA Metro Area | 17.9 | 96,922 |
| Mankato-North Mankato, MN Metro Area | 18 | 100,105 |
| Sheboygan, WI Metro Area | 18 | 115,205 |
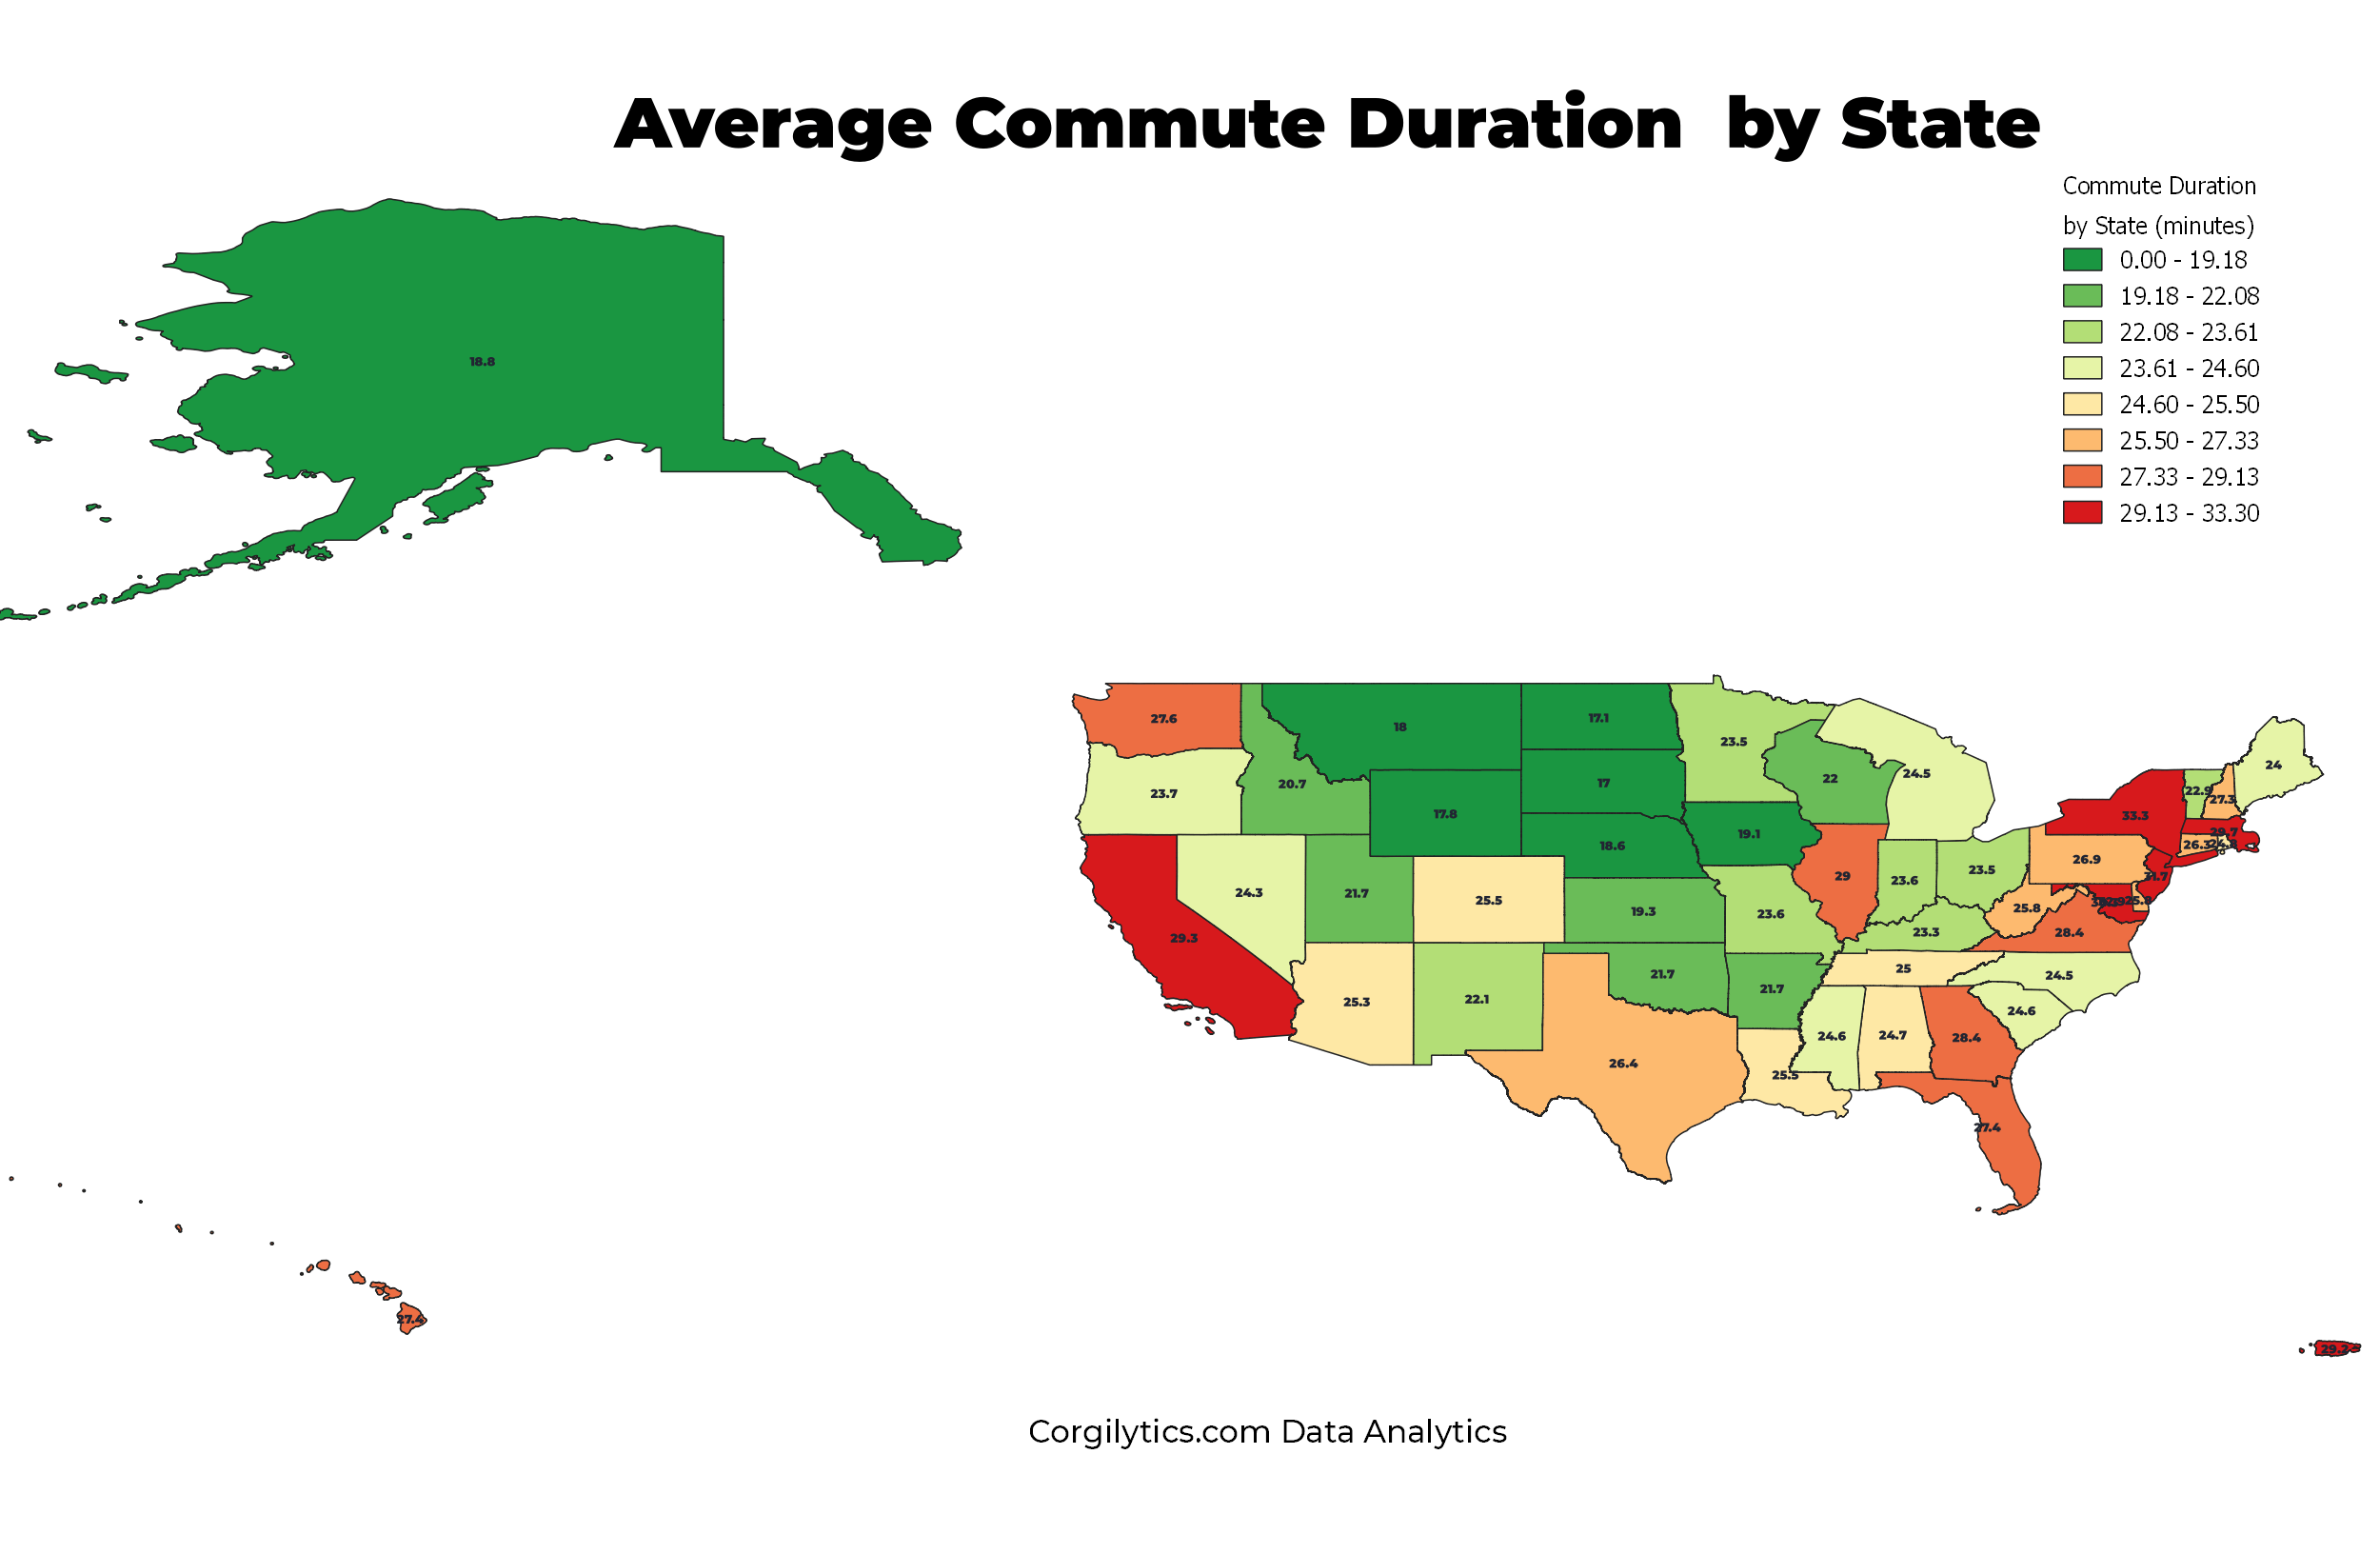
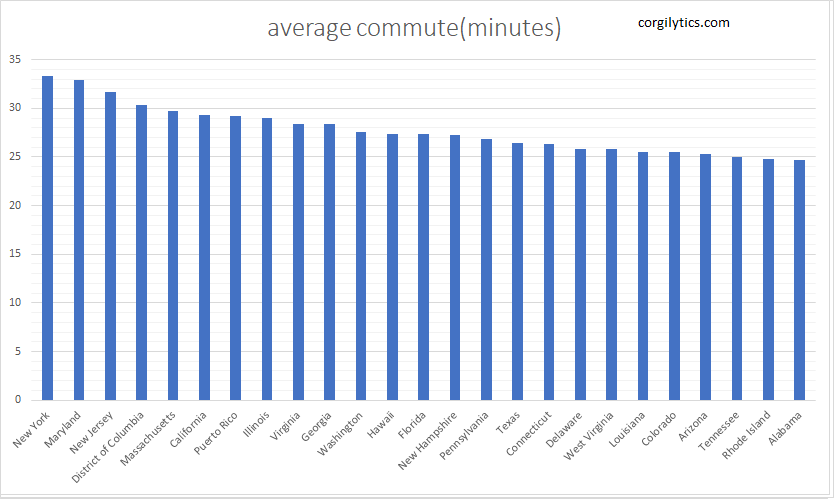
Longest Commute by State
The northeastern corridor of New York, Maryland, New Jersey, DC, and MA dominate the average commute times. These areas are densely populated– and unfortunately will have difficulty expanding highway capacity without significant efforts. The plus side is that this area has the most developed public transit systems in the country– with rail and bus service available throughout.
| geography | average commute(minutes) | geography population |
|---|---|---|
| New York | 33.3 | 19,618,453 |
| Maryland | 32.9 | 6,003,435 |
| New Jersey | 31.7 | 8,881,845 |
| District of Columbia | 30.3 | 684,498 |
| Massachusetts | 29.7 | 6,830,193 |
| California | 29.3 | 39,148,760 |
| Puerto Rico | 29.2 | 3,386,941 |
| Illinois | 29 | 12,821,497 |
| Virginia | 28.4 | 8,413,774 |
| Georgia | 28.4 | 10,297,484 |
| Washington | 27.6 | 7,294,336 |
| Hawaii | 27.4 | 1,422,029 |
| Florida | 27.4 | 20,598,139 |
| New Hampshire | 27.3 | 1,343,622 |
| Pennsylvania | 26.9 | 12,791,181 |
| Texas | 26.4 | 27,885,195 |
| Connecticut | 26.3 | 3,581,504 |
| Delaware | 25.8 | 949,495 |
| West Virginia | 25.8 | 1,829,054 |
| Louisiana | 25.5 | 4,663,616 |
| Colorado | 25.5 | 5,531,141 |
| Arizona | 25.3 | 6,946,685 |
| Tennessee | 25 | 6,651,089 |
| Rhode Island | 24.8 | 1,056,611 |
| Alabama | 24.7 | 4,864,680 |
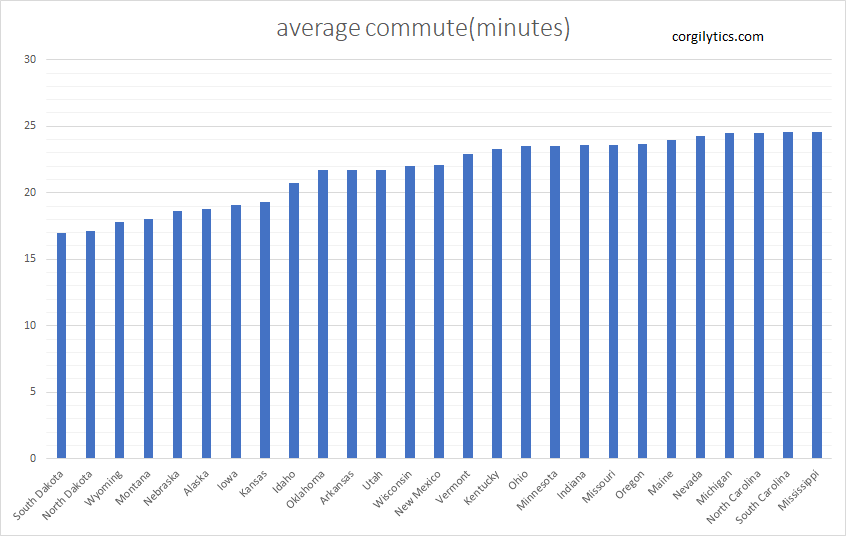
Shortest Commute by State
Once again, at the state level rural/remote states dominate the shortest commutes. It is simple civil engineering– less people, less cars, less congestion means higher average speeds. The great plains, mid-west and south are very well represented below.
| geography | average commute(minutes) | geography population |
|---|---|---|
| South Dakota | 17 | 864,289 |
| North Dakota | 17.1 | 752,201 |
| Wyoming | 17.8 | 581,836 |
| Montana | 18 | 1,041,732 |
| Nebraska | 18.6 | 1,904,760 |
| Alaska | 18.8 | 738,516 |
| Iowa | 19.1 | 3,132,499 |
| Kansas | 19.3 | 2,908,776 |
| Idaho | 20.7 | 1,687,809 |
| Oklahoma | 21.7 | 3,918,137 |
| Arkansas | 21.7 | 2,990,671 |
| Utah | 21.7 | 3,045,350 |
| Wisconsin | 22 | 5,778,394 |
| New Mexico | 22.1 | 2,092,434 |
| Vermont | 22.9 | 624,977 |
| Kentucky | 23.3 | 4,440,204 |
| Ohio | 23.5 | 11,641,879 |
| Minnesota | 23.5 | 5,527,358 |
| Indiana | 23.6 | 6,637,426 |
| Missouri | 23.6 | 6,090,062 |
| Oregon | 23.7 | 4,081,943 |
| Maine | 24 | 1,332,813 |
| Nevada | 24.3 | 2,922,849 |
| Michigan | 24.5 | 9,957,488 |
| North Carolina | 24.5 | 10,155,624 |
| South Carolina | 24.6 | 4,955,925 |
| Mississippi | 24.6 | 2,988,762 |
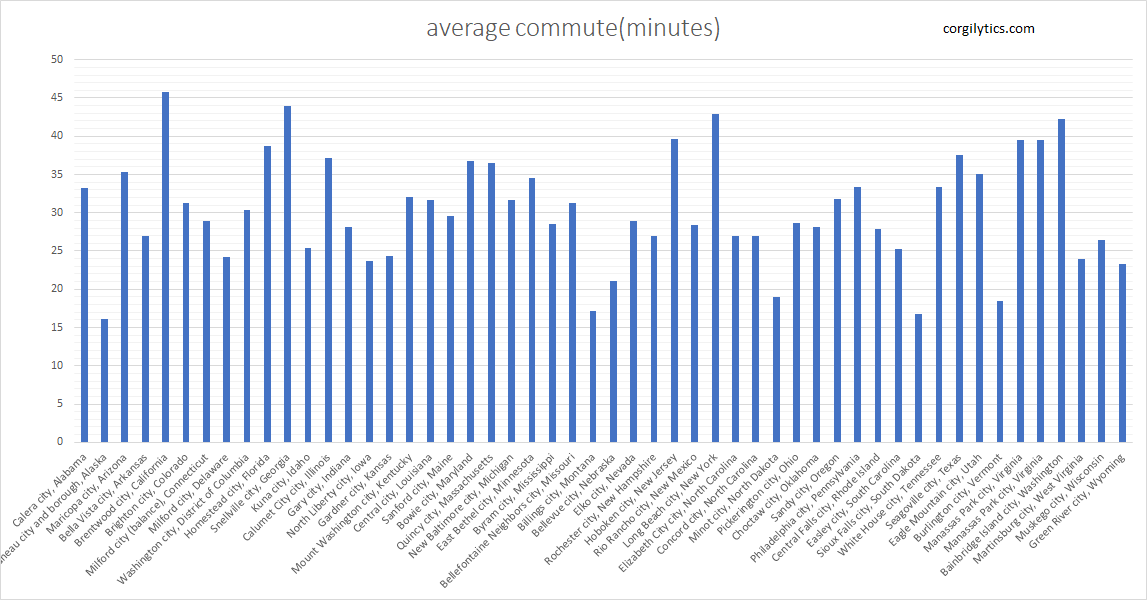
Longest Commutes by City in Each State, over 10,000 population
This is a more fun chart for middling areas who weren’t represented at the city/state/metro levels above– especially noticing how much variation there is between the longest commutes per state. Juneau, AK is the longest commute in Alaska with 16 minutes, while Brentwood, CA (the highest in the nation) is roughly 3x longer– surely there are more bears and moose (meese?) obstructing commutes in Alaska, though.
| geography | average commute(minutes) | geography population |
|---|---|---|
| Calera, Alabama | 33.2 | 13,557 |
| Juneau city and borough, Alaska | 16.1 | 32,330 |
| Maricopa, Arizona | 35.3 | 47,314 |
| Bella Vista, Arkansas | 26.9 | 28,328 |
| Brentwood, California | 45.8 | 60,446 |
| Brighton, Colorado | 31.3 | 39,054 |
| Milford city (balance), Connecticut | 28.9 | 52,349 |
| Milford, Delaware | 24.2 | 10,835 |
| Washington, District of Columbia | 30.3 | 684,498 |
| Homestead, Florida | 38.7 | 68,424 |
| Snellville, Georgia | 44 | 19,631 |
| Kuna, Idaho | 25.4 | 18,445 |
| Calumet, Illinois | 37.1 | 36,856 |
| Gary, Indiana | 28.1 | 76,677 |
| North Liberty, Iowa | 23.7 | 18,357 |
| Gardner, Kansas | 24.4 | 21,351 |
| Mount Washington, Kentucky | 32 | 14,433 |
| Central, Louisiana | 31.6 | 28,577 |
| Sanford, Maine | 29.6 | 21,015 |
| Bowie, Maryland | 36.8 | 58,368 |
| Quincy, Massachusetts | 36.5 | 94,121 |
| New Baltimore, Michigan | 31.7 | 12,365 |
| East Bethel, Minnesota | 34.5 | 11,808 |
| Byram, Mississippi | 28.5 | 11,657 |
| Bellefontaine Neighbors, Missouri | 31.3 | 10,613 |
| Billings, Montana | 17.1 | 109,431 |
| Bellevue, Nebraska | 21.1 | 53,225 |
| Elko, Nevada | 28.9 | 20,247 |
| Rochester, New Hampshire | 26.9 | 30,661 |
| Hoboken, New Jersey | 39.6 | 53,211 |
| Rio Rancho, New Mexico | 28.4 | 94,765 |
| Long Beach, New York | 42.9 | 33,509 |
| Elizabeth City, North Carolina | 27 | 17,604 |
| Concord, North Carolina | 27 | 89,729 |
| Minot, North Dakota | 19 | 48,304 |
| Pickerington, Ohio | 28.6 | 20,148 |
| Choctaw, Oklahoma | 28.2 | 12,367 |
| Sandy, Oregon | 31.8 | 10,834 |
| Philadelphia, Pennsylvania | 33.4 | 1,575,522 |
| Central Falls, Rhode Island | 27.9 | 19,382 |
| Easley, South Carolina | 25.2 | 20,784 |
| Sioux Falls, South Dakota | 16.7 | 174,151 |
| White House, Tennessee | 33.3 | 11,513 |
| Seagoville, Texas | 37.6 | 16,357 |
| Eagle Mountain, Utah | 35 | 29,919 |
| Burlington, Vermont | 18.4 | 42,513 |
| Manassas Park, Virginia | 39.5 | 16,423 |
| Bainbridge Island, Washington | 42.3 | 24,060 |
| Martinsburg, West Virginia | 24 | 17,497 |
| Muskego, Wisconsin | 26.4 | 24,868 |
| Green River, Wyoming | 23.3 | 12,278 |
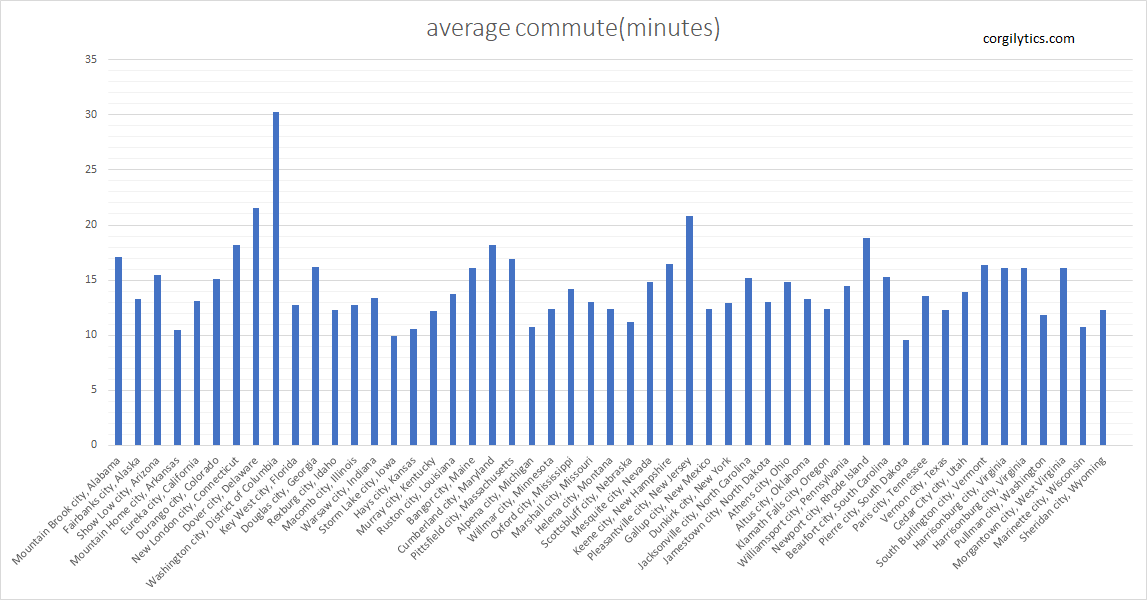
Shortest Commutes by City in Each State, over 10,000 population
Compared against longest commutes in each state, the shortest commutes are somewhat consistent, clustering relatively tightly between 10-15 minutes, typically in less populated cities– nearly every city on this list has less than 50,000 residents, with a large number having less than 25,000 residents.
| geography | average commute(minutes) | geography population |
|---|---|---|
| Mountain Brook, Alabama | 17.1 | 20,466 |
| Fairbanks, Alaska | 13.3 | 31,677 |
| Show Low, Arizona | 15.5 | 11,014 |
| Mountain Home, Arkansas | 10.5 | 12,303 |
| Eureka, California | 13.1 | 27,020 |
| Durango, Colorado | 15.1 | 18,321 |
| New London, Connecticut | 18.2 | 27,032 |
| Dover, Delaware | 21.5 | 37,331 |
| Washington, District of Columbia | 30.3 | 684,498 |
| Key West, Florida | 12.7 | 25,085 |
| Douglas, Georgia | 16.2 | 11,556 |
| Rexburg, Idaho | 12.3 | 27,957 |
| Macomb, Illinois | 12.7 | 18,118 |
| Warsaw, Indiana | 13.4 | 15,062 |
| Storm Lake, Iowa | 9.9 | 10,672 |
| Hays, Kansas | 10.6 | 20,956 |
| Murray, Kentucky | 12.2 | 19,037 |
| Ruston, Louisiana | 13.7 | 22,055 |
| Bangor, Maine | 16.1 | 32,098 |
| Cumberland, Maryland | 18.2 | 19,845 |
| Pittsfield, Massachusetts | 16.9 | 43,058 |
| Alpena, Michigan | 10.7 | 10,086 |
| Willmar, Minnesota | 12.4 | 19,618 |
| Oxford, Mississippi | 14.2 | 23,037 |
| Marshall, Missouri | 13 | 13,001 |
| Helena, Montana | 12.4 | 31,212 |
| Scottsbluff, Nebraska | 11.2 | 14,805 |
| Mesquite, Nevada | 14.8 | 17,904 |
| Keene, New Hampshire | 16.5 | 23,165 |
| Pleasantville, New Jersey | 20.8 | 20,374 |
| Gallup, New Mexico | 12.4 | 22,105 |
| Dunkirk, New York | 12.9 | 11,950 |
| Jacksonville, North Carolina | 15.2 | 73,226 |
| Jamestown, North Dakota | 13 | 15,368 |
| Athens, Ohio | 14.8 | 24,771 |
| Altus, Oklahoma | 13.3 | 19,034 |
| Klamath Falls, Oregon | 12.4 | 21,138 |
| Williamsport, Pennsylvania | 14.5 | 28,757 |
| Newport, Rhode Island | 18.8 | 24,762 |
| Beaufort, South Carolina | 15.3 | 13,336 |
| Pierre, South Dakota | 9.6 | 13,988 |
| Paris, Tennessee | 13.6 | 10,042 |
| Vernon, Texas | 12.3 | 10,685 |
| Cedar City, Utah | 13.9 | 31,009 |
| South Burlington, Vermont | 16.4 | 18,975 |
| Harrisonburg, Virginia | 16.1 | 53,391 |
| Pullman, Washington | 11.8 | 33,050 |
| Morgantown, West Virginia | 16.1 | 30,539 |
| Marinette, Wisconsin | 10.7 | 10,678 |
| Sheridan, Wyoming | 12.3 | 17,825 |
That’s a wrap for this study. If you have ideas for a study you’d like to read, or need to easily perform market research like this on any city (or even zip code), check out the
free geoexplorer tool or contact us for a Corgilytics platform demo.